G- GENERAL STATISTICS AND LEGAL ASPECTS
633
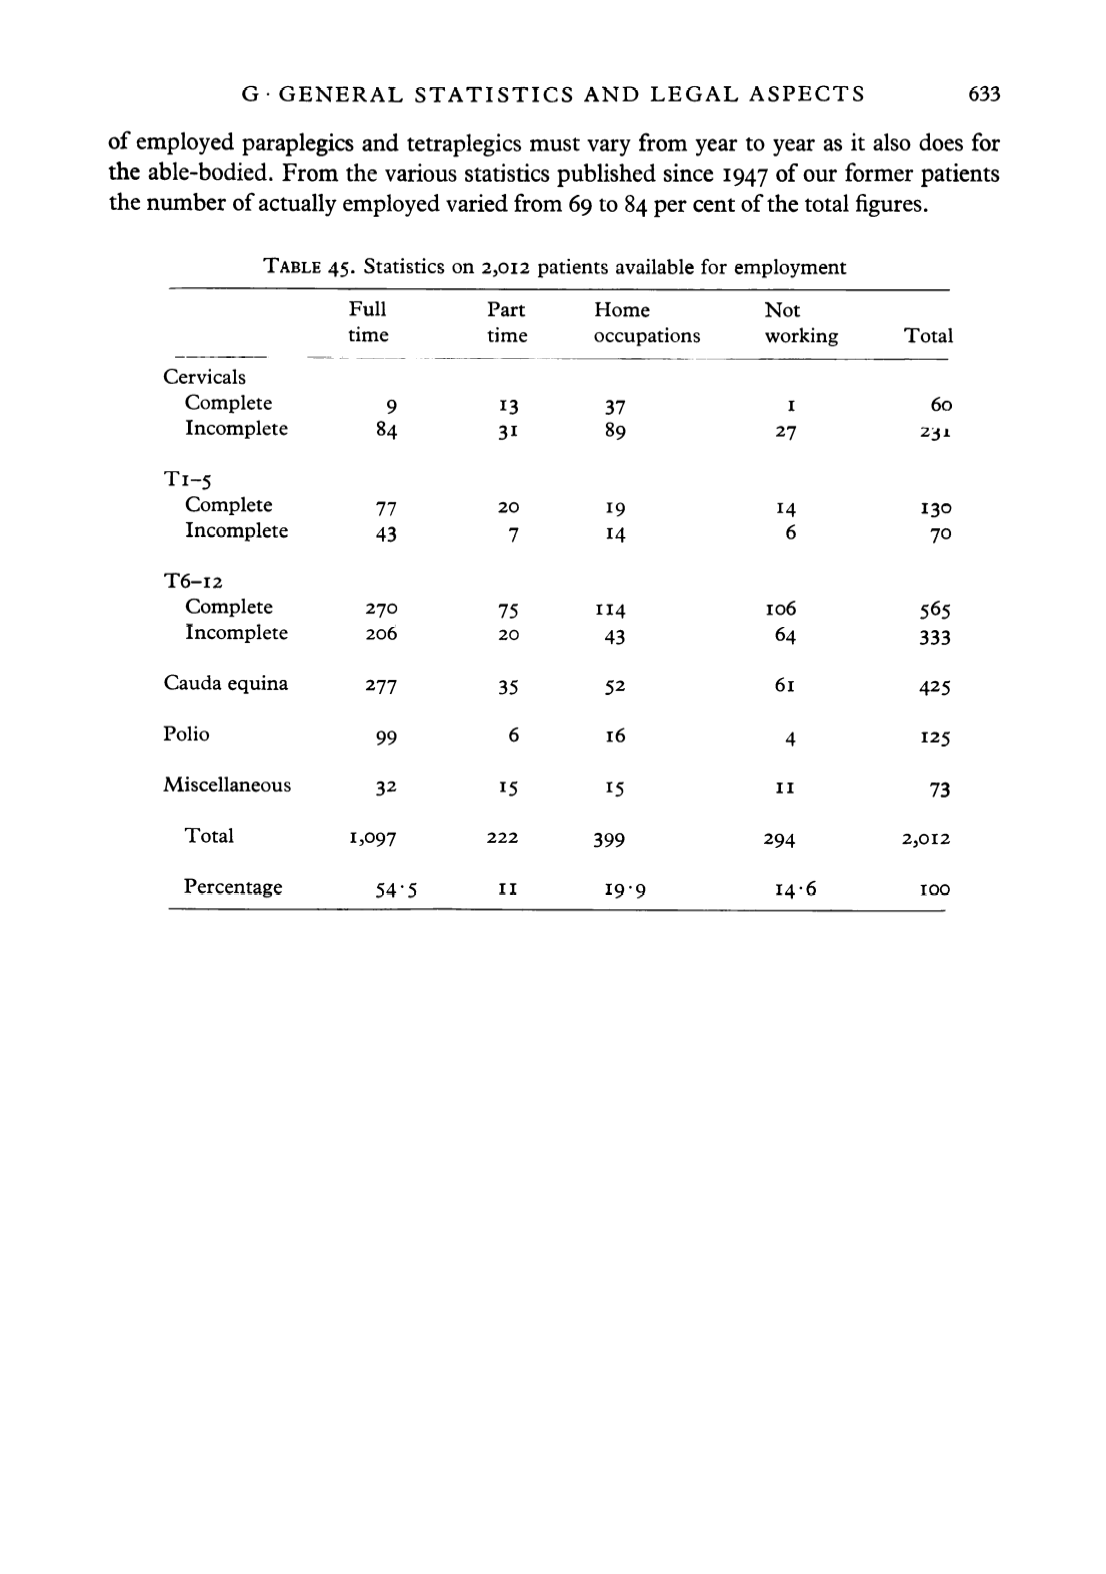
of employed paraplegics and tetraplegics must vary from year to year as it also does for
the able-bodied. From the various statistics published since 1947 of our former patients
the number of actually employed variedfrom 69 to 84 per cent of the total figures.
TABLE 45. Statistics on 2,012 patients available for employment
Cervicals
Complete
Incomplete
Ti-5
Complete
Incomplete
T6-I2
Complete
Incomplete
Cauda equina
Polio
Miscellaneous
Total
Full
time
9
84
77
43
270
206
277
99
32
1,097
Part
time
13
31
20
7
75
20
35
6
15
222
Home
occupations
37
89
19
14
114
43
52
16
15
399
Not
working
I
27
14
6
1 06
64
61
4
ii
294
Total
60
231
130
70
565
333
425
125
73
2,012
Percentage
54-5
n
19-9
14-6
100


